We're very excited to announce that, starting with Microsoft Edge 120, we're making a new experimental DevTools feature available to all. You can now ask DevTools to explain any error or warning, and any code snippet by using Copilot in Edge.
Whether you're new to web development or have already been building websites, errors and warnings in the DevTools Console is something you probably deal with all the time.
While some errors make sense and help you correct bugs, some can be very obscure or even scary. Can you confidently say what the following errors mean, without searching?
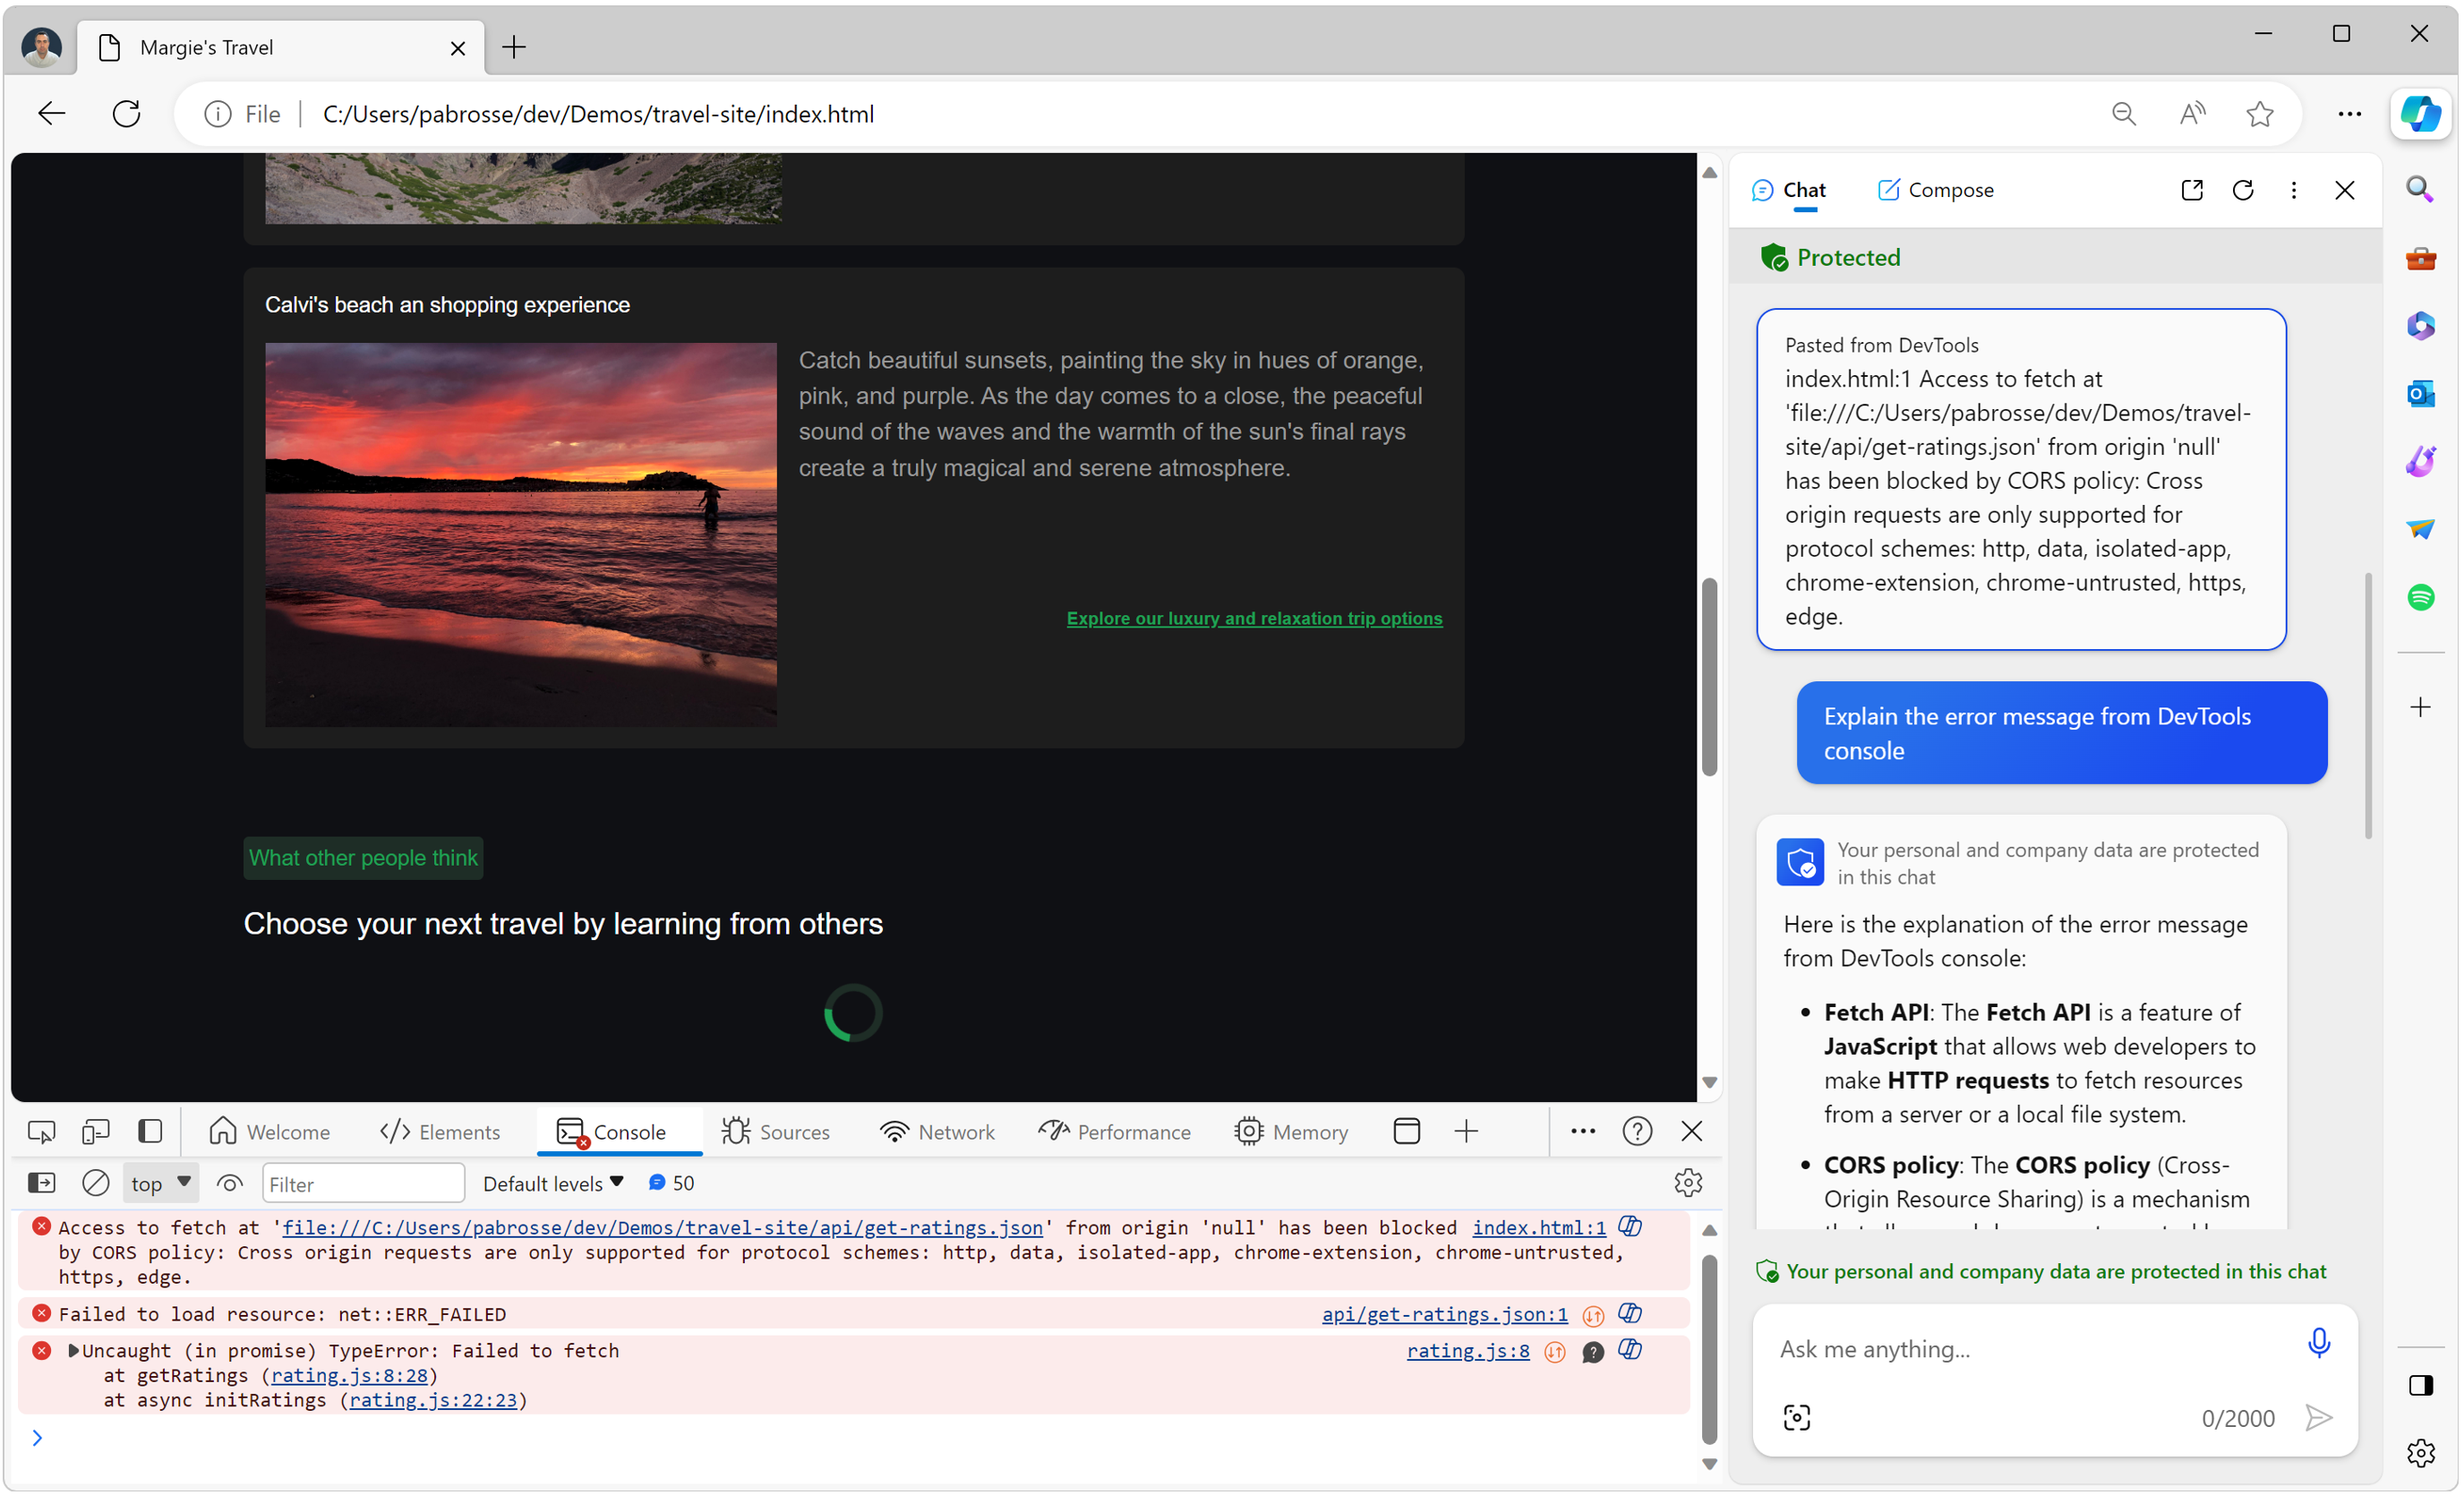
![Microsoft Edge with DevTools and Copilot both visible. Errors are shown in the Console, and Copilot is explaining what one of the errors mean.]() With Copilot in Edge integrated into DevTools you can:
With Copilot in Edge integrated into DevTools you can:
Access to fetch at 'https://www.microsoft.com/' from origin 'https://microsoftedge.github.io' has been blocked by CORS policy: No 'Access-Control-Allow-Origin' header is present on the requested resource. If an opaque response serves your needs, set the request's mode to 'no-cors' to fetch the resource with CORS disabled.
Uncaught (in promise) SyntaxError: Unexpected token '<', "<!DOCTYPE "... is not valid JSON.
Uncaught TypeError: Converting circular structure to JSON.
Uncaught TypeError: Cannot define property x, object is not extensible.
These errors can very often feel cryptic, especially when learning web development. But they also play a very important role in learning. They're how the browser tells you something's wrong, where it's wrong, and perhaps how to fix the problem.
Unlike other languages, JavaScript doesn't require a compilation step to run. C++ or Rust, for example, give you a lot of information at compilation time. With JavaScript, these runtime errors in the DevTools console are often your only way to know something's wrong. But let's face it, compilers and JS engines are similar in that they don't always make it easy to understand what they're trying to say.
Common solutions include:
- Searching for the error message online, hoping to find a useful answer.
- Or asking a coworker for help.
 With Copilot in Edge integrated into DevTools you can:
- Ask Copilot to explain any error or warning displayed in the Console. Just click the Copilot button next to an error:
![A Console error from DevTools, showing the Copilot icon next to it]()
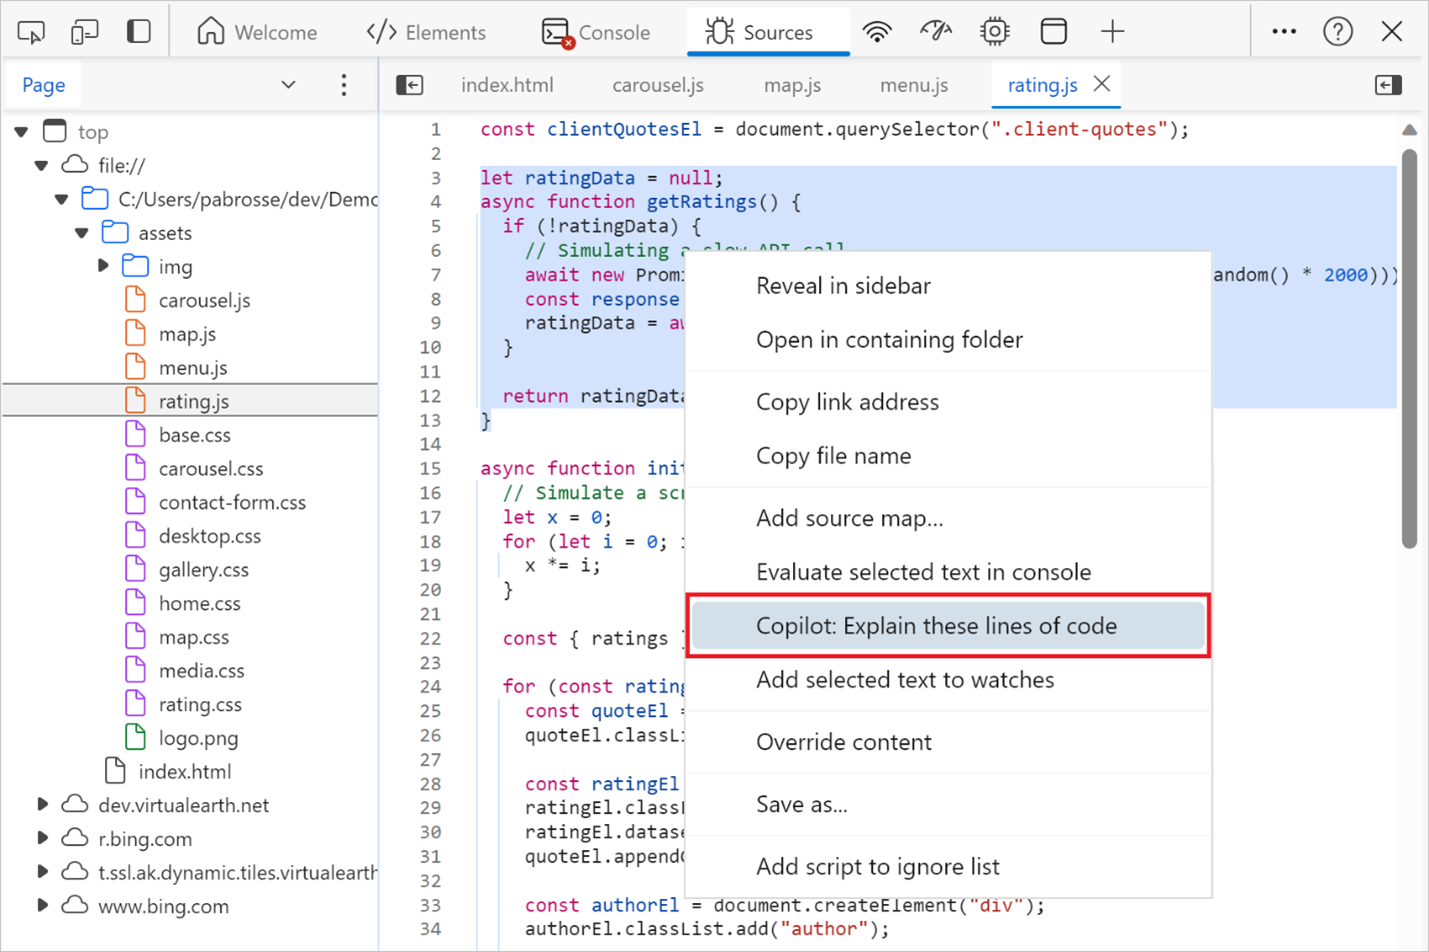
- Ask Copilot to explain any snippet of code selected in the Sources tool. Just select some code, right-click, and choose Copilot: Explain these lines of code:
![The Sources tool in DevTools. Some code is selected and the contextual menu is displayed. The Copilot menu item is selected.]()